Map Alignment#
The pyOpenMS map alignment algorithms transform different maps (peak maps, feature maps) to a common retention time axis.
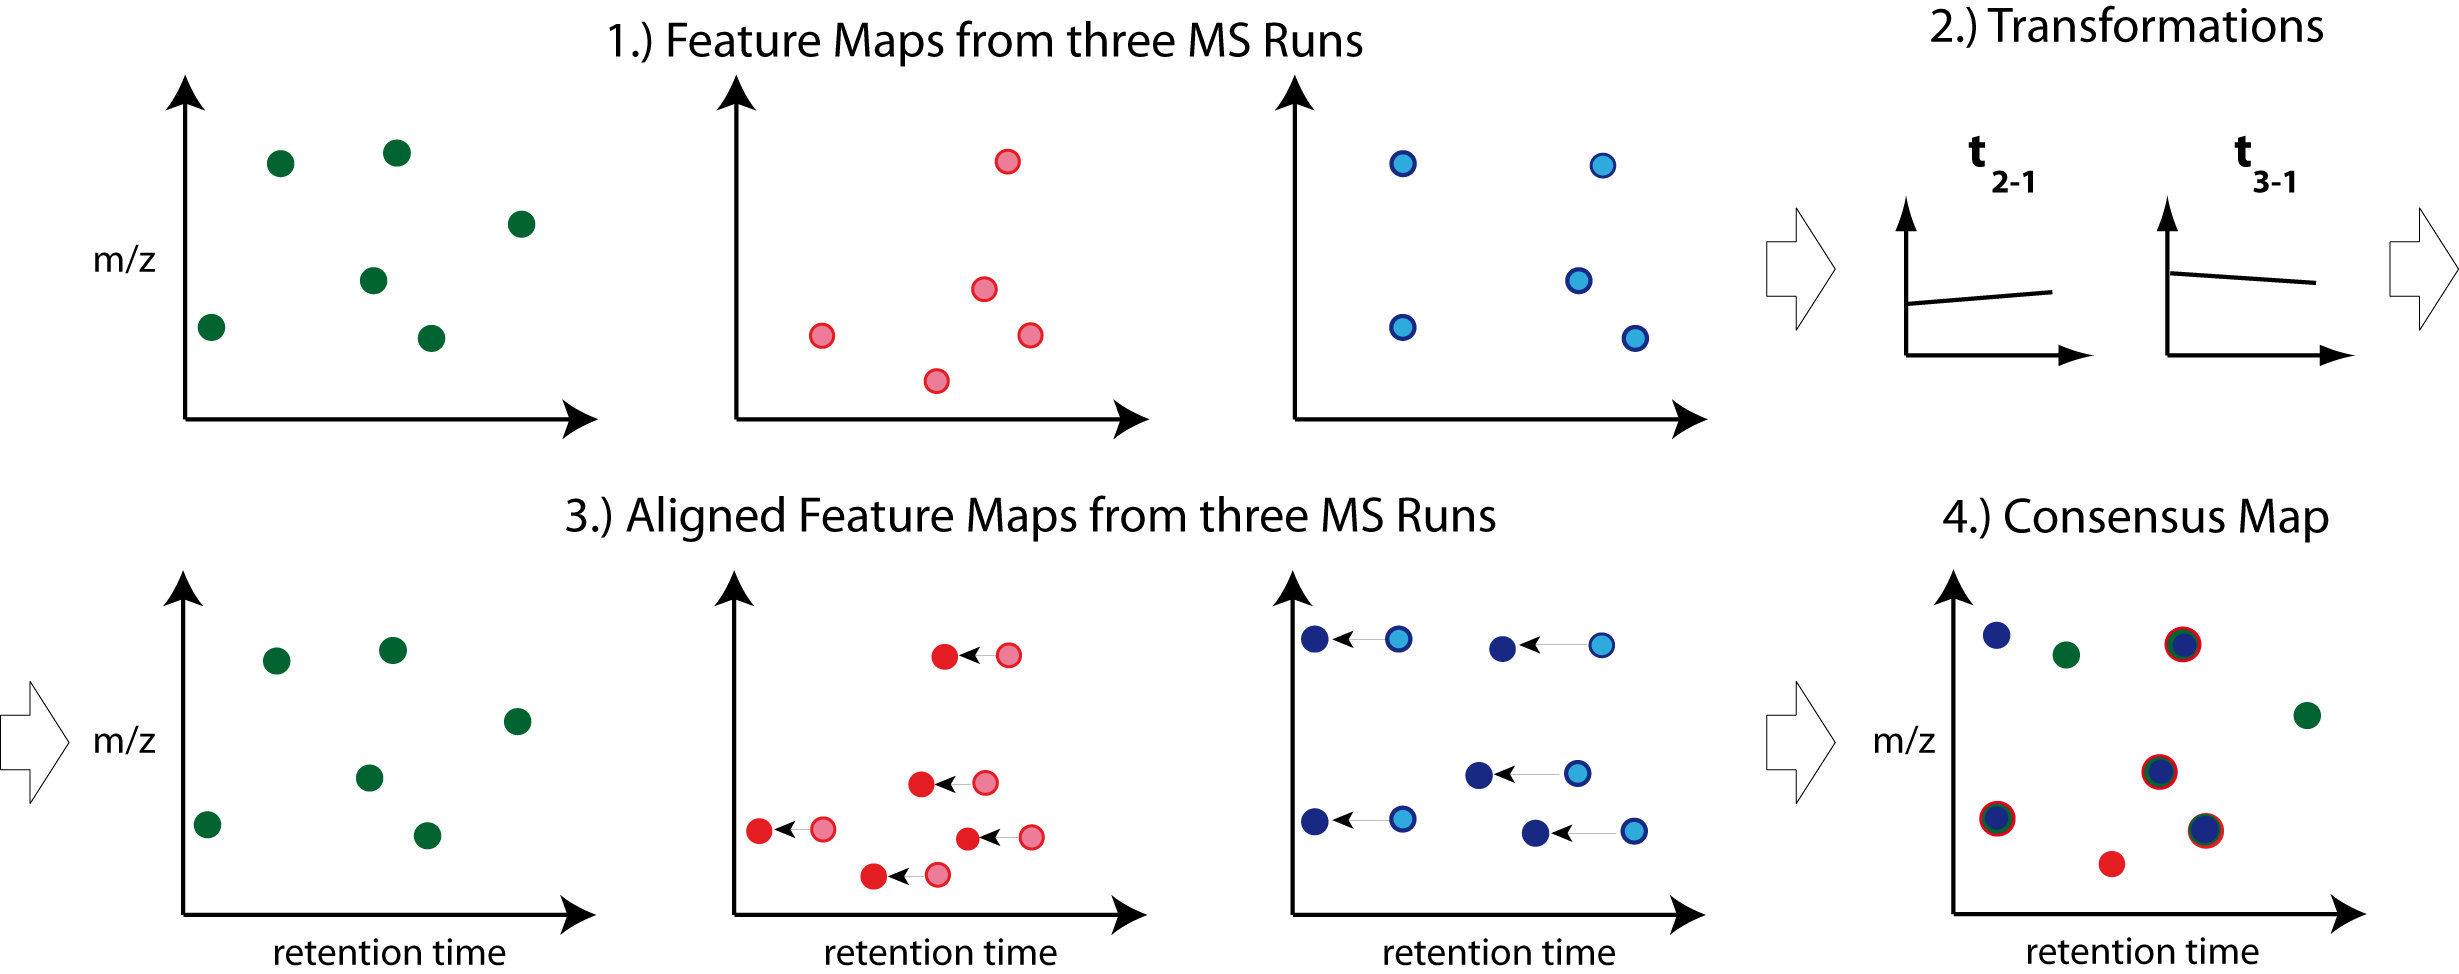
Note: Creating a consensus map from the aligned maps is performed by a feature linking algorithm (see next chapter).
Different map alignment algorithms are available in pyOpenMS:
MapAlignmentAlgorithmPoseClustering
MapAlignmentAlgorithmIdentification
MapAlignmentAlgorithmSpectrumAlignment
MapAlignmentAlgorithmKD
MapAlignmentTransformer
To perform a simple linear alignment we can employ the algorithm MapAlignmentAlgorithmPoseClustering. In the example below it is used for the alignment of feature maps.
Download Example Data#
from pyopenms import *
from urllib.request import urlretrieve

base_url = 'https://raw.githubusercontent.com/OpenMS/pyopenms-docs/master/src/data/'

feature_files = ['BSA1_F1.featureXML', 'BSA2_F1.featureXML', 'BSA3_F1.featureXML']

feature_maps = []

# download the feature files and store feature maps in list (feature_maps)
for feature_file in feature_files:
    urlretrieve (base_url + feature_file, feature_file)
    feature_map = FeatureMap()
    FeatureXMLFile().load(feature_file, feature_map)
    feature_maps.append(feature_map)
Map Alignment Algorithm#
From the list of feature maps, the one with the largest number of features is selected for reference. The retention times of the other feature maps are aligned to this.
#set ref_index to feature map index with largest number of features
ref_index = [i[0] for i in sorted(enumerate([fm.size() for fm in feature_maps]), key=lambda x:x[1])][-1]

aligner = MapAlignmentAlgorithmPoseClustering()

aligner.setReference(feature_maps[ref_index])

# perform alignment and transformation of feature maps to the reference map (exclude reference map)
for feature_map in feature_maps[:ref_index] + feature_maps[ref_index+1:]:
    trafo = TransformationDescription()
    aligner.align(feature_map, trafo)
    transformer = MapAlignmentTransformer()
    transformer.transformRetentionTimes(feature_map, trafo, True) # store original RT as meta value
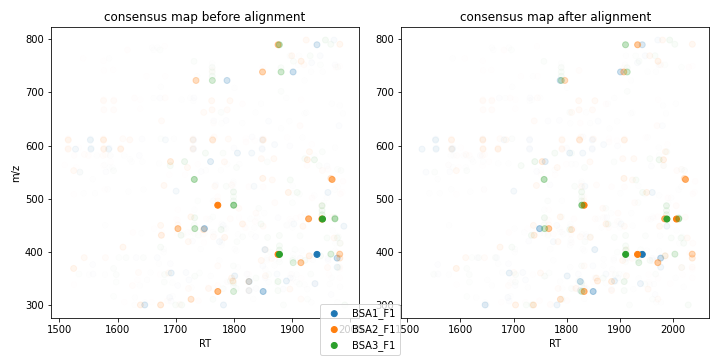
Visualization#
Plotting consensus maps with features before and after alignment.
import matplotlib.pyplot as plt
import numpy as np

fmaps = [feature_maps[ref_index]] + feature_maps[:ref_index] + feature_maps[ref_index+1:]

fig = plt.figure(figsize=(10,5))

ax = fig.add_subplot(1, 2, 1)
ax.set_title('consensus map before alignment')
ax.set_ylabel('m/z')
ax.set_xlabel('RT')

# use alpha value to display feature intensity
ax.scatter([f.getRT() for f in fmaps[0]], [f.getMZ() for f in fmaps[0]],
            alpha = np.asarray([f.getIntensity() for f in fmaps[0]])/max([f.getIntensity() for f in fmaps[0]]))

for fm in fmaps[1:]:
    ax.scatter([f.getMetaValue('original_RT') for f in fm], [f.getMZ() for f in fm],
                alpha = np.asarray([f.getIntensity() for f in fm])/max([f.getIntensity() for f in fm]))

ax = fig.add_subplot(1,2,2)
ax.set_title('consensus map after alignment')
ax.set_xlabel('RT')

for fm in fmaps:
    ax.scatter([f.getRT() for f in fm], [f.getMZ() for f in fm],
                alpha = np.asarray([f.getIntensity() for f in fm])/max([f.getIntensity() for f in fm]))

fig.tight_layout()
fig.legend([fmap.getDataProcessing()[0].getMetaValue('parameter: out')[:-11] for fmap in fmaps], loc = 'lower center')
fig.show()